Young-earth creationists are often described as people who reject evolutionary theory. But their biological model actually requires evolution at a breathtaking speed.
According to the standard young-earth account, nearly every terrestrial vertebrate alive today descends from a few individuals that departed Noah’s Ark about 4,350 years ago. Most animal “kinds” were represented by a single reproductive pair, while some clean animals may have been represented by seven pairs. From those few founders somehow emerged wolves, foxes, coyotes, and jackals; lions, tigers, leopards, and house cats; hundreds of rodent species; thousands of bats species; and an astonishing range of extinct forms (100 extinct species of elephant species after the Flood), all in a few thousand years (or far less in the case of extinct elephants).
That doesn’t strike me as a model with little biological change. No, It is a model requiring enormous amounts of genetic, anatomical, ecological, and behavioral change compressed into a fraction of the time evolutionary biologists ordinarily consider possible.
As a biologist, I find this fascinating. I have spent much of my professional life thinking about where genetic diversity comes from, how quickly it accumulates, how rapidly it is lost during population bottlenecks, and what patterns these processes leave behind in genomes.
Any reader of this blog will know I have also spent a great deal of my personal time reading young-earth creationist literature. I do this partly because I remain deeply interested in how my fellow Christians understand creation, but also because young-earth creationism makes unusually specific claims about biological history. If hundreds of animal kinds passed through severe population bottlenecks at approximately the same time only 4,300 years ago, their genomes should bear unmistakable evidence of that event.
This is why a new paper by Harry F. Sanders III in Answers Research Journal caught my attention. The paper, “Diversity Expectations Within a Baramin,” attempts to explain why different created kinds—or baramins—contain different amounts of genetic diversity.
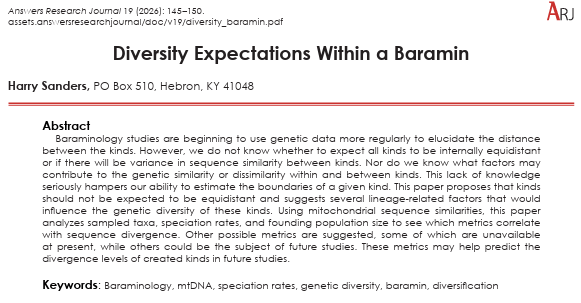
Sanders begins with a real problem for baraminology. Creationists have often hoped that genetic comparisons would reveal distinct boundaries between created kinds: high similarity within a kind, followed by a conspicuous genetic break separating it from every other kind. But no universal sequence-similarity threshold has emerged. One proposed kind may contain species with very similar genomes, while another contains species with genomes separated by much greater genetic distances.
Sanders suggests that this should not surprise us. Different kinds may have begun with different numbers of founders. They may have possessed different amounts of created genetic variation. They have different generation times, mutation rates, dispersal abilities, habitats, and histories of species formation. Consequently, he argues, we should not expect every created kind to contain the same amount of genetic divergence.
On this rather narrow point, I agree. But then again, any evolutionary biologists would readily answer in the same way.
Mutation rates do differ among organisms. Population size affects genetic drift. Some populations pass through severe bottlenecks, while others remain large. Selection removes some mutations and preserves others. Generation time, reproductive biology, migration, geographic isolation, and extinction all influence the genetic variation we observe today.
Different groups of organisms should not be expected to show identical levels of genetic variation. Mutation rates differ. Population sizes differ. Some lineages pass through severe bottlenecks while others retain large populations. Selection removes some mutations while allowing others to persist. Generation time, reproductive biology, migration, geographic isolation, and extinction all matter.
Sanders is also right to recognize that a single percentage of mitochondrial similarity is unlikely to reveal the boundary of every proposed kind. That is an important admission because it concedes that the hoped-for genetic discontinuities are not simply waiting to be uncovered by choosing the correct cutoff.
In fact, this is one of the most valuable admissions in the paper. Baraminologists have often hoped that molecular data might reveal a clean genetic gap separating organisms within a kind from those outside it. The accumulating data have as yet to produce such a universal boundary. Sanders is trying to explain why.
I welcome the attempt to develop explicit expectations. I would much rather see young-earth creationists construct quantitative models and expose them to testing than simply declare that rapid post-Flood diversification must have occurred because their reading of Genesis requires it.
But this raises an important question: Does Sanders actually test whether the observed genetic diversity could have arisen from Ark founders in 4,326 years?
Unfortunately, he does not.
The paper discusses many factors that could influence genetic diversity, but listing relevant factors is not the same as constructing a population-genetic model. Its principal statistical relationships are partly produced by the way the variables were defined. Its proposed “speciation rate” is not an independently measured rate at all. It confuses variation within populations with divergence between species, incorrectly states how quickly heterozygosity disappears, and never calculates whether measured mitochondrial mutation rates could generate the observed differences within the available time.
The paper therefore illustrates a recurring problem in young-earth biological modeling: the model is allowed to require enormous evolutionary change, but the rates, mechanisms, and genomic consequences of that change are rarely calculated.
And once we begin doing those calculations, the problem becomes much more difficult than saying that God created the original animals with “lots of diversity.”
There is no doing this quickly, so this is going to be a long one. Let’s take a closer look at some of the claims made in this article.
The most divergent pair will become more divergent as the sample grows
Sanders uses mitochondrial sequence-similarity values taken from a previous study by Matthew Cserhati. That study compared mitochondrial genomes from more than 1,000 mammal species. For each mammalian family, Cserhati recorded what he called the minimum sequence similarity, or MSS. In plain language, he found the two most genetically dissimilar sampled species in the family and recorded the similarity between them.
Sanders then asks whether families containing more species tend to have lower minimum similarity. He finds that they do.
At first glance this sounds biologically meaningful. A family with many species appears to contain more genetic divergence than a family with only a few. Perhaps, Sanders suggests, greater post-Flood speciation produced greater mitochondrial diversity. But there is a basic sampling problem here. If I sample only three species, I have three possible pairwise comparisons. If I sample ten species, I have 45 comparisons. If I sample 30 species, I have 435. At 60 species, I have 1,770 comparisons.
The more comparisons I make, the more likely I am to encounter an unusually divergent pair. That would be true even if every family were being sampled from the same underlying distribution of genetic distances. It is the same reason that the tallest person in a city of one million will generally be taller than the tallest person in a village of one hundred. The larger population need not have a different biological process producing height. It simply provides many more opportunities to encounter an extreme value.
Here the response variable is an extreme value: the lowest similarity among all sampled pairs. We should therefore expect it to decline as the number of sampled species increases.
Sanders performed permutation tests, but shuffling values among families does not correct this structural problem. A more appropriate analysis would repeatedly subsample the same number of species from every family, or use a statistic such as mean pairwise divergence, median divergence, or standardized total phylogenetic branch length. I know that, sounds like a lot of jargon but Sanders should know what these things are and account for them. The upshot is that until taxon sampling is standardized, we cannot know how much of the reported relationship represents biological history and how much is simply the predictable behavior of a minimum.
A “speciation rate” that is really just species richness
The second problem is more consequential. Sanders estimates the speciation rate of each kind by taking its current number of species and dividing by 4,326 years, his estimated time since the Flood:
Speciation rate = number of living species ÷ 4,326 years
That calculation does not measure the speciation rate. It takes present-day species richness and rescales it by the same constant for every family. I’ve seen this simple accounting method in other creationist literature, so Sanders is not unique here and maybe he thought that since other creationists do this it is appropriate. If that is the case, he has been led astray by a simplistic creationist’s metric.
Suppose one family contains 100 species and another contains ten. Dividing both numbers by 4,326 tells us that the first family has ten times the calculated “rate” of the second. But we already knew that the family had ten times as many species. No new historical information has been added. More importantly, the assumed date of the Flood contributes nothing to the statistical result. Sanders could divide by 10,000 years, 100,000 years, or 10 million years. The numerical values would change, but the ordering of the families, the correlation, and the statistical significance would remain the same. On a logarithmic scale, changing the date merely shifts every point by a constant.
The calculation therefore cannot test whether 4,326 years is sufficient time to produce the species. That timescale has been inserted into the labels but not actually tested by the analysis.
Nor does the calculation account for how speciation works. Species formation is a branching process. Some lineages split early, others late, and many go extinct. A family with ten living species could have produced hundreds of extinct species. A family with 100 living species might be the product of one recent radiation. Simply dividing the surviving species by time ignores the tree connecting them and every extinct branch that once belonged to it.
Sanders has found a relationship between minimum mitochondrial similarity and current species richness. Calling species richness a “speciation rate” makes the conclusion sound more historical than it is.
Genetic diversity is not one thing
As I read the paper, I repeatedly encountered the word diversity being used for several different quantities. This is an easy problem to slip into because all these quantities concern genetic differences, but population genetics distinguishes them for good reasons.
Heterozygosity is the probability that the two copies of a gene in a diploid individual or population are different. Nucleotide diversity measures average sequence differences among individuals within a population. Mutation rate describes how frequently new variants arise. Substitution rate describes how frequently mutations eventually become established as differences between lineages. Among-species divergence measures differences accumulated since lineages separated, along with variation inherited from their common ancestral population. Species richness is simply the number of recognized species.
These quantities are related, but they are not interchangeable.
A mutation can arise and disappear in the next generation. Another may remain polymorphic in a population for thousands of generations. A third may eventually become fixed in one lineage and absent from another. Selection, genetic drift, population size, and migration help determine which path it takes. As mitochondrial geneticist David Rand has emphasized, mutation is not the same as polymorphism, and polymorphism is not the same as substitution.
Sanders’s response variable is divergence among mitochondrial genomes belonging to different species. But much of his discussion concerns heterozygosity within founding individuals. One cannot move directly from one to the other. A quantitative model must describe how alleles initially carried by founders were transmitted into descendant populations, sorted among emerging species, lost by drift, retained by selection, or converted into fixed differences.
The paper never constructs that bridge and thus does not provide us with useful results.
Heterozygosity does not halve every generation
One sentence especially surprised me. Sanders writes that, assuming created heterozygosity, we know that “heterozygosity drops by half in each generation.”
That is not a general principle of population genetics.
Heterozygosity is halved each generation when a heterozygous organism repeatedly self-fertilizes. Mammals do not reproduce by self-fertilization. In a finite randomly mating population, the expected decline in neutral heterozygosity is approximately
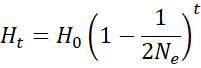
where (
A population founded by one male and one female would experience severe inbreeding and genetic drift. Its exact trajectory would depend on the pedigree, reproductive success, sex ratio, population growth, and subsequent subdivisions. But that is precisely why a demographic model is needed. “Half per generation” cannot substitute for one.
There is also a hard limit on what “created heterozygosity” can initially provide. Two diploid founders carry at most four copies of an ordinary autosomal locus. They can therefore begin with no more than four alleles at that locus. Seven pairs can carry at most 28 copies. Recombination can rearrange those alleles into new combinations, but it cannot manufacture additional allelic states.
If creationists want to propose that the founders were designed with immense amounts of functional variation, that is a proposal they are free to investigate. But it must specify how many alleles existed, how they were arranged across chromosomes, how much linkage disequilibrium they produced, and what patterns should remain after 4,300 years. Otherwise “created diversity” becomes a reservoir of unspecified size from which any required outcome can be drawn.
Mitochondrial DNA makes the Ark problem sharper
The paper’s focus on mitochondrial DNA creates another complication. Mitochondrial genomes are usually inherited through the mother. They are effectively haploid and do not possess ordinary nuclear heterozygosity. Within an individual there can be mitochondrial heteroplasmy (more than one mitochondrial sequence type in a single mitochondria or cell) but that is not what geneticists ordinarily mean when discussing a maximally heterozygous diploid founder.
Consider an unclean mammalian kind represented on the Ark by one male and one female. The nuclear genome of both founders can contribute to their descendants. But under ordinary maternal inheritance, only the female’s mitochondrial lineage is passed forward. The male’s mitochondria reach his offspring’s egg only in exceedingly rare cases of paternal leakage.
Thus all surviving mitochondrial diversity in such a kind would have to descend from one founding maternal genome, unless the model explicitly proposes substantial ancestral heteroplasmy or nonstandard inheritance. Seven founding females could supply more mitochondrial haplotypes for a clean kind, but still only a small, finite number.
This should produce a powerful test. The mitochondrial genomes of every species descended from a one-pair Ark kind ought to trace back to one maternal lineage at the Flood boundary. The number of differences among them should be compatible with mutations arising and becoming established during the subsequent 4,326 years.
Sanders does not perform that calculation. I encourage him to explore this as I have no doubt that this will illuminate many new issues with the creationist’ model that would need to be explored.
Can 4,326 years generate the observed differences?
Cserhati reports that minimum mitochondrial similarity among mammalian families can be as low as 75 percent. If such a family is treated as a single created kind, its two most divergent sampled members differ at roughly one-quarter of their mitochondrial sequence.
Let us do a deliberately simple calculation. If two descendant lineages accumulated those differences independently for 4,326 years, an uncorrected estimate would require approximately
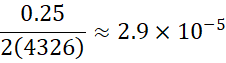
fixed differences per nucleotide site per lineage per year.
A mammalian mitochondrial genome contains roughly 16,500 bases. Multiplying those values gives close to one-half of a fixed mitochondrial substitution per lineage every year.
This is only a first-pass calculation. A BLAST similarity score is not a properly corrected evolutionary distance. Multiple mutations can occur at the same site, different parts of the mitochondrial genome evolve at different rates, and purifying selection removes many changes. Correcting for those effects would not make the required historical problem disappear. At 25 percent observed difference, multiple hits would generally mean that the actual number of substitutions was larger than the raw difference suggests do in large part to many mutations resulting in reversals to the ancestral state.
This is the calculation I most wanted to see in the paper when I saw the title. How many mutations are needed? How many generations are available for a bat, mouse, elephant, or whale? How many new mitochondrial mutations are observed per generation? What fraction survive selection and drift to become lineage differences? Do the required changes occur primarily at synonymous sites and rapidly evolving control regions, as an accelerated natural process would predict, or are they spread across highly constrained genes where rapid change would compromise mitochondrial function?
Those questions get us close to a genuine model. I recognize that addressing these questions is not an easy task but it is a necessary one. A correlation between species counts and a sampling-dependent minimum does not get us close to a model creationist or otherwise.
One mitochondrial genome is not a species history
There is another reason for caution. The mitochondrial genome is inherited as essentially one linked unit. It is not equivalent to sampling thousands of independent nuclear genes. I understand Sanders is looking for a simpler proxy to estimate genetic diversity and knows that it has limitations but those limitations may be for more limiting that he realizes or recognizes.
Mitochondrial history can differ from species history because of introgression, incomplete lineage sorting, selective sweeps, maternal population structure, and sex-biased dispersal. Two species can possess very similar mitochondrial genomes because one acquired mitochondria from the other through past hybridization. Populations within one species can carry surprisingly divergent mitochondrial lineages. Natural selection acting on mitochondrial function can alter the apparent rate as well.
These are not rare technical exceptions that can safely be ignored when defining created kinds. They are among the reasons modern species-delimitation studies combine mitochondrial data with many independently inherited nuclear loci, geography, morphology, ecology, and explicit coalescent models.
If baraminology is trying to identify real historical boundaries, it cannot rely on a similarity threshold from a single maternally inherited genetic unit even as a first approximator.
The families in the analysis are not equivalent experiments
Sanders provisionally treats mammalian families as created kinds unless previous baraminological research places a boundary elsewhere. But taxonomic families are human-named ranks, not standardized units of time or genetic distance. One family may represent a relatively recent radiation. Another may contain several old, deeply separated subfamilies. I have worked extensively on species in the genus Isoetes. Members of that genus may have diverged more than 60 million years ago but are placed in a single genus due to their similar morphology and life habit while the entire order of Carnivora (cats, dogs, bears etc.) all diverged from one another in about half that time. Some contain hundreds of species and others only one. Their fossil records and extinction histories differ dramatically.
Nor are these families statistically independent. Bat families share inherited features with other bats. Cetacean families share life histories with other cetaceans. Rodent families share characteristics inherited from their common ancestors. Ordinary regression treats each family as though it were an independent replicate, but comparative biology has long recognized that related groups resemble one another partly because of shared history. This is why phylogenetic comparative methods exist and are effective tools.
The problem becomes especially visible in Sanders’s analysis of founding population size. He assigns a value of two to ordinary Ark kinds, 14 to clean and flying kinds, and ten to aquatic mammals that supposedly survived outside the Ark. But ten marine survivors is not observed or derived from an independent biological source. It is an assumed number chosen to represent a heavy Flood cull. These categories are also clustered by biology and ancestry. Cetaceans receive one value, bats may receive another, and many terrestrial families receive a third.
A statistically significant association involving those assigned numbers cannot verify the assumptions used to create them. It may instead reflect the biological differences among the groups to which the numbers were attached.
What the evolutionary model already expects
Sanders’s first hypothesis is that created kinds will not all contain equal genetic divergence. That is reasonable, but I do not find this to be a distinctive prediction of young-earth creationism. Evolutionary biology already expects clades to differ in genetic divergence. They have different ages, mutation rates, effective population sizes, extinction histories, generation times, selective regimes, and patterns of geographic isolation. A large literature investigates why some mammalian clades are species rich while others are not, and why mitochondrial substitution rates vary among lineages.
Indeed, Sanders cites a study reporting a relationship between mutation rate and diversification in birds, but does not discuss a directly relevant mammalian study by Xavier Goldie, Robert Lanfear, and Lindell Bromham. That study found no detectable relationship between mammalian clade size and either nuclear or mitochondrial substitution rates. The literature is more complicated than the handful of examples assembled in this paper suggest.
To me, this illustrates a larger problem. A useful young-earth model must predict something different from what evolutionary models already predict. “Different groups contain different amounts of diversity” does not do that. Neither does “groups with more sampled species tend to include a more divergent pair.”
The question is whether the exact genetic patterns observed today can emerge from a nearly simultaneous set of severe bottlenecks only 4,326 years ago.
What a real post-Flood genetic model would look like
I do not think it is impossible for young-earth creationists to formulate a testable population-genetic model. In fact, the model’s compressed timescale and unusually specific founding events should make it easier to derive risky predictions that if born out would be significant achievement for a creationist worldviewe.
For each proposed Ark kind, researchers could specify as best they can: The number and sex of the founders, the nuclear alleles and mitochondrial haplotypes carried by those founder, population growth after the Flood, generation times through the proposed history, empirically measured mutation rates, recombination, drift, and selection, migration routes and serial founder events, the timing and mechanism of species formation, the number and timing of extinctions
From those assumptions, forward simulations could predict modern heterozygosity, allele-frequency spectra, linkage disequilibrium, runs of homozygosity, mitochondrial haplotype trees, divergence distributions, and the amount of discordance among nuclear gene trees.
The model should also predict the genomic signature of a severe bottleneck occurring at nearly the same time across most terrestrial mammalian families. If one female founded each unclean kind’s post-Flood mitochondrial population, the model should place a strict upper bound on the number and age of maternal lineages. If created nuclear variation supplied most modern diversity, the model should predict how those original alleles are distributed among descendant species and how much variation must have arisen afterward.
Then those predictions could be compared with whole-genome data and with conventional demographic models that allow deeper divergence and changing population sizes over much longer periods.
Most importantly, the creationist model would need to tell us what evidence could prove it wrong. If every unexpected divergence can be explained by greater created diversity, an elevated mutation rate, a different kind boundary, an undocumented number of Flood survivors, or an unusually rapid burst of speciation, then the model can accommodate nearly any outcome. Its flexibility becomes its weakness.
A promising question, but not yet an answer
Let’s go back and see where we have come. Sanders is asking a worthwhile question. He recognizes that genetic diversity within proposed kinds cannot be understood with one universal similarity threshold. He acknowledges that mutation, demography, generation time, dispersal, extinction, and ecology all matter. I regard that as progress over the simpler claim that mitochondrial genomes will reveal an obvious divinely created boundary if only creationists choose the correct percentage.
But the present analysis does not show that Ark founder number or rapid post-Flood speciation produced the observed patterns. Its central relationship is partly built into the use of minimum similarity. Its speciation-rate variable is species richness divided by a constant. It confuses within-population heterozygosity with among-species divergence, misstates how heterozygosity is lost, and does not address the special maternal inheritance of the mitochondrial genome. Above all, it never asks whether measured mutation and substitution processes can generate the required divergence in 4,326 years.
What the paper establishes is much narrower: mammalian families with more sampled or recognized species tend to contain a more divergent sampled pair of mitochondrial genomes. That observation is compatible with ordinary evolutionary history and is partly expected from sampling alone.
As a biologist who has played with some of these forms of analyses, I find the deeper question far more interesting. What would the genomes of millions of modern species actually look like if most terrestrial biodiversity had passed through hundreds of nearly simultaneous two-individual bottlenecks only a few thousand years ago? That question has answers. Genomes preserve population history with remarkable persistence. They record bottlenecks, expansions, ancestral population sizes, introgression, selection, and the branching order of lineages.
Young-earth creationists should not be afraid to let their model explore those data in full. As a Christian, neither am I. Creation does not require us to protect it from careful investigation. If our interpretation of its history is correct, the details should strengthen it. If the details consistently require us to revise the model after every observation, then intellectual honesty requires us to reconsider the model rather than indefinitely expanding its explanatory escape routes.
That is not a retreat from faith. It is confidence that truth need not fear examination.
Blessings,
Joel
References and further reading
Sanders, H. F., III. (2026). Diversity Expectations Within a Baramin. Answers Research Journal, 19, 145–150.
Cserhati, M. (2026). Mitogenomic Baraminology Analysis and the Search for the Baraminic Demarcation Values Among Class Mammalia. Creation Research Society Quarterly, 62(4), 276–284.
Allendorf, F. W. (2024). What does effective population size tell us about loss of allelic variation?
Bergeron, L. A., et al. (2023). Evolution of the germline mutation rate across vertebrates. Nature, 615, 285–291.
Goldie, X., Lanfear, R., & Bromham, L. (2011). Diversification and the rate of molecular evolution: No evidence of a link in mammals. BMC Evolutionary Biology, 11, 286.
Rabosky, D. L., & Benson, R. B. J. (2021). Ecological and biogeographic drivers of biodiversity cannot be resolved using clade age-richness data. Nature Communications, 12, 2945.
Rand, D. M. (2008). Mitigating mutational meltdown in mammalian mitochondria. PLoS Biology, 6(2), e35.


[like] Matthew Williams reacted to your message: ________________________________
LikeLike